Rankevra Blog
Google Trends Explained: How to Use It for SEO in 2026
July 18, 2026
What Google Trends Actually Shows (And What It Doesn't)
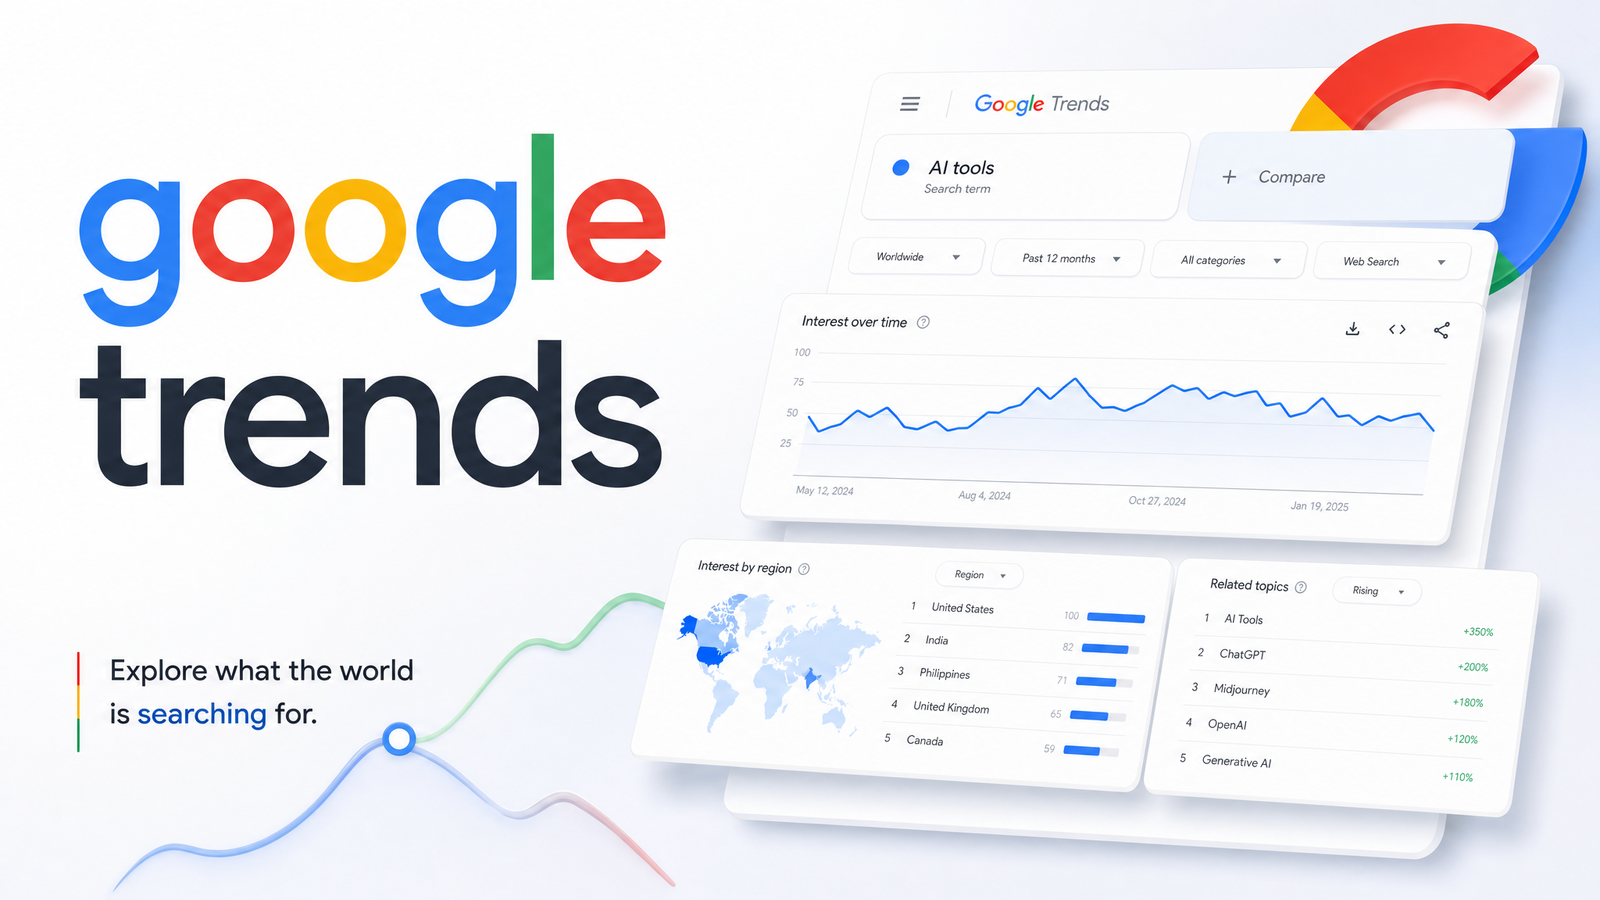
Google Trends is a free tool that shows how interest in a search term changes over time, relative to all other searches in the same time period and location. Every number you see is relative, not raw. When you search a term, Google Trends hands you a normalized index from 0 to 100, where 100 marks the point of peak popularity for that term within your chosen window, and every other point is scaled against it.
This is the most misunderstood part of the tool, and the source of most bad keyword decisions. A score of 50 doesn't mean "50,000 searches" or "half as popular as some universal maximum." It means half as popular as that term's own highest point in the range you selected. Change the date range, region, or category, and the scale resets — the same keyword can show wildly different curves depending on what you're comparing it against.
Google's own documentation is blunt: relative search interest is a comparison tool, not a volume counter. If you want to know what is Google Trends and how it works at the data level, that's the core mechanic — sampling from a portion of actual Google searches, normalizing the results, and presenting a curve rather than a count. It's excellent for spotting momentum and comparing topics against each other. It's the wrong tool for estimating how many people actually type a phrase into Google each month.
How the Data Is Built: Sampling, Normalization, and Noise
Trends doesn't process every search on Google — it works from a sample of total search traffic, which keeps the tool fast but introduces natural variance. That's why you'll sometimes refresh a graph and see the line shift slightly, especially for lower-volume or niche terms where the sample size is smaller and statistical noise has more room to move the needle.
Google's FAQ about Google Trends data explains this directly: data is normalized by time and location, deduplicated, categorized by topic, and adjusted so results are comparable across periods. Time zones also matter — Trends aggregates data based on when a search happened in a specific region, so day-level comparisons across countries can behave unexpectedly if you're not filtering carefully.
None of this means the tool is unreliable. It means you should treat single-day spikes with skepticism, favor weekly or monthly views for stable reads, and expect small day-to-day fluctuation on anything outside the mainstream. Once you understand the sampling and normalization behind the curve, the "why did this number change" mystery mostly disappears.
What's New in Google Trends for 2026
The tool marketers used five years ago isn't the one available now. The most significant shift is the Trending Now dashboard, which moved from periodic updates to a refresh cycle of roughly every 10 minutes, giving near real-time visibility into what's surging across search. Coverage has also expanded — Trending Now now spans well over 100 countries, a jump Search Engine Journal documented as part of a broader 2024 overhaul that reshaped how fast and how broadly emerging queries surface.
That overhaul also added forecasting elements — signals that flag which rising topics have staying power based on historical pattern-matching, not just current velocity, a capability Wikipedia's entry on Google Trends traces back through the tool's evolution since its 2004 launch. On top of that, Google has layered a Gemini-powered AI side panel directly into Trends, letting users ask plain-language questions about a chart — why a term spiked, what related events might explain it, how it compares historically — instead of manually cross-referencing news and related queries.
For SEO teams, this matters because Google Trends real-time data in 2026 is genuinely closer to real-time than at any point in the tool's history, and the gap between "something is trending" and "you know about it" has shrunk from hours to minutes. The bottleneck has shifted entirely to what you do with that visibility.
Reading Trends Correctly: 5 Practical Checks Before You Act
Before you greenlight content based on a Trends chart, run it through five quick filters:
- Time range. Default views can flatten or exaggerate patterns. Pull at least 12 months for anything you're not certain is seasonal, and compare against the same period last year before calling something new.
- Geography. A term "trending" worldwide might be flat in your target market. Always filter to the country or region your content actually serves.
- Search type. Web, YouTube, Image, News, and Shopping searches behave differently. A term breaking out on YouTube search doesn't guarantee organic web demand — check the type that matches your content format.
- Topic vs. Search Term. Selecting a Topic groups related phrasings and translations together; a Search Term isolates exact matches. Topics give a broader momentum read, Search Terms give you precision — know which one you're looking at before drawing conclusions.
- Rising vs. breakout. "Rising" queries show a percentage increase; "Breakout" means growth exceeded 5,000%, usually from a near-zero baseline. Breakout labels look dramatic but often describe tiny absolute numbers — treat them as a starting signal, not proof of demand.
These checks are really the core of how to use Google Trends for SEO: disciplined filtering before you commit resources to a topic.
Trend or Fad? How to Tell If a Topic Is Worth Content Investment
Not every rising query deserves a blog post. The dividing line between a fad and a genuine opportunity usually comes down to three questions.
First, does the curve show prior cycles? Pull the five-year view. Topics tied to recurring events, product cycles, or seasonal search trends — back-to-school, tax deadlines, annual product launches — show repeating bumps you can plan content around in advance, rather than reacting after the fact.
Second, is the spike tied to a single news event or a structural shift? A celebrity mention or one-off headline typically produces a sharp vertical spike followed by an equally sharp drop. A structural shift — a new regulation, a widely adopted product category, a platform change — tends to produce a slower climb that holds or continues rising after the initial peak.
Third, does related-query data show expanding intent, not just repeated mentions of the same triggering event? If the "related queries" panel is dominated by variations of the same news term, interest is likely tied to that single event. If it's branching into how-to, comparison, and buyer-intent phrasing, that's a signal of a topic building genuine informational demand — worth building a content cluster around. That's also the point where it's worth grouping related and rising queries into a structured plan using a process like keyword clustering for topical authority, rather than publishing one-off posts chasing each spike individually.
Trends should never operate alone here. Cross-check any promising topic against a real volume source — Google Keyword Planner or a similar keyword tool — before committing writer hours. This is the core distinction behind Google Trends vs. search volume: Trends tells you direction and timing, keyword tools tell you scale. Use Trends to decide when and whether a topic is heating up, and a volume tool to decide if it's big enough to matter once you commit resources.
From Spotted Trend to Ranked Page: Closing the Speed Gap
Here's the part most Trends guides leave out: spotting a rising query was never the hard part. With a 10-minute refresh cycle and an AI panel explaining the "why" behind a spike, visibility is nearly instant. The real bottleneck is everything that happens after — briefing a writer, drafting, editing, publishing, and then tracking whether the page actually moves in rankings before the topic's window closes. That chain, done manually across even a handful of rising queries a week, is where most teams lose the trend entirely.
This is the gap Rankevra is built to close. Instead of treating trend-spotting, drafting, publishing, and rank tracking as four separate tools stitched together by hand, Rankevra's AI runs them as one pipeline: it surfaces rising queries worth acting on, drafts and structures content around them, publishes it, and then tracks ranking movement automatically — so the lag between "this is trending" and "we have a ranked page" shrinks from days to a workflow you can run repeatedly. For the broader publishing framework this fits into, see Content Marketing Strategy: An SEO Growth System, and for how trend-timing ties into the bigger traffic picture, Organic Traffic Growth in 2026: What Actually Works Now is the natural next read.
Spotting the signal was always the easy 10%. Publishing and ranking before the curve peaks is the other 90% — and it's the part worth automating.
Frequently Asked Questions
Is Google Trends data the same as search volume?
No. Google Trends shows relative search interest on a 0-100 scale, normalized against the peak point in your selected time range and location — it does not report actual search counts. For real monthly search volume, pair Trends with a dedicated tool like Google Keyword Planner.
How far back does Google Trends data go?
Google Trends data goes back to 2004, covering two decades of search interest history. This makes it useful for spotting recurring seasonal patterns and long-term category growth, not just recent spikes.
Why does my Google Trends graph change when I refresh it?
Trends draws from a sample of total search traffic rather than every single search, so small statistical variance is normal, especially for lower-volume or niche terms. Google's own FAQ on Trends data confirms this sampling and normalization process as the expected cause, not a tool malfunction.
Can Google Trends replace a keyword research tool?
No. Trends is a timing and prioritization signal that shows momentum and relative comparison between terms, while keyword research tools estimate actual monthly search volume and competition. The two are complementary — use Trends to decide when and whether interest is rising, and a volume tool to confirm the opportunity is big enough to pursue.
How often does Google Trends update its data?
The Trending Now dashboard refreshes roughly every 10 minutes as of the 2024-2026 overhaul, a major jump from its earlier update cycle. Historical Explore data updates on a daily or near-real-time basis depending on the time range selected.
Is Google Trends free to use for commercial SEO work?
Yes, Google Trends is free for anyone, including businesses and agencies using it for commercial SEO research. There's no paid tier or usage limit for standard access to the Explore page, Trending Now dashboard, or related-query data.
Keep reading
- Content Decay SEO: How to Detect It and Fix It for GoodLearn to detect content decay SEO issues early, rule out false positives, and build a refresh pipeline that scales — plus how to automate the whole loop.
- Headless CMS SEO: Fixing the Gaps Generic Tools MissHeadless CMS SEO breaks in three predictable places: rendering, metadata, and sitemaps. Here's the diagnostic framework to find and fix each gap.
- Google Algorithm Update Recovery: A Diagnostic FrameworkA step-by-step google algorithm update recovery framework: confirm the cause, segment the damage, benchmark against winners, and set a real timeline.