Rankevra Blog
SEO A/B Testing: A DIY Framework Using Only GSC
September 7, 2026
What SEO A/B Testing Actually Means (and Why It's Not CRO)
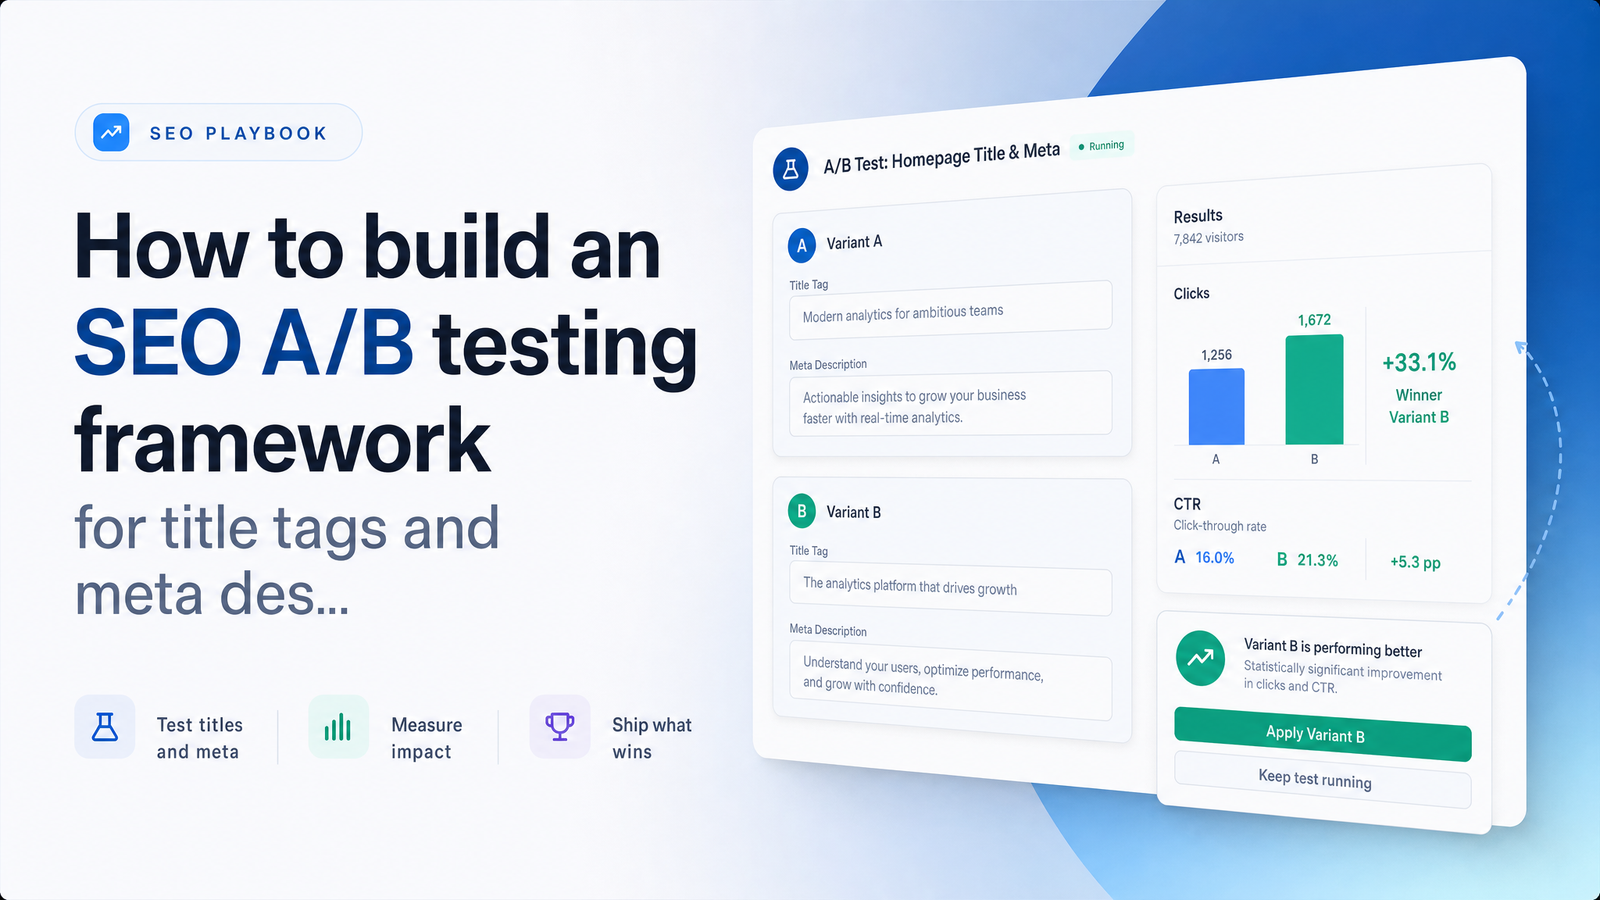
SEO A/B testing changes a page element — usually a title tag or meta description — on one group of pages while leaving a similar group unchanged, then compares click-through rate between the two groups over time. That's meaningfully different from conventional CRO, where you split users into buckets and show each a different version in real time. Google indexes exactly one version of a URL, so split testing SEO works by splitting pages, not sessions: a control set keeps its existing title, a variant set gets a new one, and you compare aggregate performance across a matched time window.
That constraint is why title tags and meta descriptions are the right place to start. Neither requires backend changes, design work, or user-facing risk — you're editing metadata, not the page experience. Meta descriptions aren't even a ranking factor; they only influence clicks, making them close to a "free" test with little downside (MarketingProfs). Title tags carry more weight since Google does weigh them in ranking, so a title change should be watched for position shifts as well as CTR shifts (SEOcrawl). Either way, you're testing incremental copy changes with low technical risk and a clear, measurable outcome: more clicks per impression.
The No-Tool Stack: What You Actually Need
You don't need a dedicated CRO or testing platform. For most sites under a few thousand pages, four things get you there:
- Google Search Console — your source of truth for impressions, clicks, CTR, and average position by page and query.
- A spreadsheet (Google Sheets works fine) — for tracking hypotheses, page groups, dates, and calculations.
- A CMS with bulk-edit, or reliable export/import — so you can push variant titles and descriptions to a defined page set without hand-editing each one.
- A shared doc for hypotheses — so nobody re-runs a test that already failed, or forgets which pages are in which group three weeks in.
This stack substitutes for an enterprise CRO platform because the core requirement isn't fancy statistics — it's discipline. A Google Search Console A/B test is really a data-pull-and-compare exercise, and Sheets handles that math just as well as a paid dashboard for the volume most independent sites work with. For more on getting the most out of your GSC data, see Google Search Console Tips That Actually Drive Action.
Step 1: Write a Falsifiable Hypothesis
"Improve CTR" isn't a hypothesis — it's a wish. A usable hypothesis names the specific change and predicts the direction and rough size of the effect.
Title tag examples:
- "Moving the brand name from the front to the end of the title will increase CTR on product pages because the keyword will appear first in the truncated snippet."
- "Adding the current year to informational titles will increase CTR because searchers read it as a freshness signal."
- "Shortening titles to under 60 characters will reduce truncation and increase CTR," a hypothesis worth testing given that Backlinko's analysis of 4 million search results found title length and structure correlate with CTR variance.
Meta description examples:
- "Adding a specific number (e.g., '12 examples') to the meta description will increase CTR versus a generic summary."
- "Adding a direct CTA phrase ('See pricing') will increase CTR on comparison pages versus a passive description."
Each hypothesis should name the element, the change, the page type it applies to, and the expected direction. Write it down before you touch anything.
Step 2: Group Pages Into Control and Variant Sets
Pick pages that are genuinely comparable before you split them. Group by template (blog posts vs. product pages vs. category pages), by traffic tier (similar impression volume over the last 90 days), and by ranking position range (all currently sitting between, say, position 5 and 15) so you're not comparing a page that ranks #2 against one that ranks #40. This is the core discipline behind page grouping — confounding variables like seasonality or template differences will drown out your signal if you skip it.
Once you have a comparable pool, split it randomly into a control group (no changes) and a variant set (gets the new title or description). Randomizing — not hand-picking your "best" pages for the variant — is what keeps the comparison honest. Set a minimum impression threshold per page, typically at least 100–200 impressions over the test window, so a handful of lucky or unlucky pages don't skew the group average.
Step 3: Set Duration and Sample Size Before You Launch
Commit to a test length and a minimum sample size before you make any changes, and write both into your hypothesis doc. Checking results daily and stopping the moment the variant looks good is the fastest way to declare a false winner — a phenomenon known as peeking.
Most practitioners land on four to six weeks minimum, long enough to smooth out day-of-week variance and catch at least one full indexing/re-crawl cycle for the affected pages (userp.io). Before launch, rough-estimate your sample size by looking at historical impressions for the page group: if your control and variant groups combined are pulling in only a few hundred impressions a month, you likely won't reach a detectable signal in a reasonable window, and you should either widen the page pool or extend the timeline.
Step 4: Pull and Compare the Data in Search Console
Once the test window closes, export a Search Console performance report filtered by the URLs in each group and by the exact date range of the test. Pull clicks, impressions, and CTR for the control group and the variant group separately, plus a "before" baseline covering an equivalent period prior to launch.
Build a simple comparison spreadsheet with rows for each group and columns for: total impressions, total clicks, CTR, and the percentage-point delta versus baseline. Average at the group level, not the individual page level — sum clicks and impressions across all pages in each group, then calculate CTR from those totals, rather than averaging each page's individual CTR. That avoids letting one low-impression outlier distort the picture. For a refresher on filtering and segmenting this report, the Google Search Console Tips guide covers the mechanics.
Step 5: Check Statistical Significance Without Paid Software
A CTR difference between two groups doesn't automatically mean the variant caused it — it could be noise. Before declaring a winner, run a two-proportion z-test (or a chi-square test) comparing clicks-per-impressions between control and variant. You don't need paid software: several free online calculators accept "clicks" and "impressions" for two groups and return a p-value directly.
Look for a result at the 95% confidence threshold before you call it — the same bar used in standard A/B testing practice (userp.io). A result below that threshold means the difference could plausibly be random variation, and the honest move is to extend the test rather than announce a win. Resist the temptation to stop early just because the numbers look encouraging in week two.
Common Ways DIY SEO Tests Go Wrong
Most SEO A/B testing mistakes trace back to a handful of repeatable failures:
- Algorithm updates mid-test. A core update landing halfway through your window can shift rankings and CTR for reasons that have nothing to do with your variant. Check Google's update timeline before finalizing results.
- Google rewriting titles or descriptions. Google frequently overrides both, especially titles it judges too long, keyword-stuffed, or mismatched to page content. If Google rewrote your variant mid-test, verify the live SERP snippet, not just what you published.
- Sample sizes too small to detect anything. Low-impression page groups produce noisy, inconclusive results no matter how long you wait.
- Testing multiple variables at once. Changing the title, the description, and the URL slug simultaneously means you can't attribute the CTR change to any one factor.
- Confusing ranking movement with CTR movement. A position jump from 8 to 4 will lift CTR on its own, independent of your copy change — always check average position for both groups before crediting the copy.
Deciding What to Do With the Result
Once you've confirmed significance, decide between three paths: roll out the winning title tag site-wide across the matching template, revert to the control version, or extend the test if the result is directionally positive but not yet significant. Don't let "it went up" alone drive the call.
Before rolling out, weigh CTR gains against ranking-position changes for the variant group. A 20% CTR lift paired with a two-position ranking drop may be a net loss in absolute clicks; a CTR lift with stable or improved position is a clean win worth deploying broadly. Track position over the following weeks using a dedicated rank tracker rather than relying on manual GSC checks, since ranking effects often lag the metadata change by several days. Once you've got a validated result, document it properly — see SEO Reporting Dashboard: What to Include and How to Build It for a template that makes reporting test outcomes to stakeholders straightforward.
When to Stop Doing This by Hand
The spreadsheet-and-GSC method holds up fine for one or two tests running at a time across a manageable page set. It breaks down once you're running several concurrent tests across dozens of templates, tracking multiple hypothesis docs, exporting overlapping date ranges, and manually pushing variants live without a mistake. At that scale, the manual grind isn't the hypothesis-writing or the analysis — it's variant generation, safe publishing, and staying on top of which pages are in which test.
That's the point to automate rather than keep expanding your spreadsheet. An AI SEO workflow like Rankevra generates title and meta description variants at scale, publishes them to the right page groups without manual copy-paste, and tracks both CTR and ranking position changes in one place — flagging statistical significance automatically instead of requiring you to run a calculator by hand each time.
Ready to Scale Past the Spreadsheet?
The manual approach works, and running it once or twice will teach you more about your audience's click behavior than any tool's documentation. But it doesn't scale past a handful of concurrent tests before the tracking and publishing overhead outgrows what a spreadsheet can manage cleanly. Rankevra automates the parts that get tedious at scale — generating variants, pushing them live, and tracking rank and CTR changes together — so you can run more tests, on more page templates, without the manual grind.
Frequently Asked Questions
What is SEO A/B testing?
SEO A/B testing compares two versions of a page element — typically a title tag or meta description — across two groups of similar pages, rather than across two groups of users. Because Google indexes one version of a URL at a time, the test splits pages into a control group and a variant group and compares aggregate CTR between them over a matched date range.
How long should an SEO A/B test run?
Most SEO A/B tests need at least four to six weeks to produce a reliable signal, long enough to smooth out day-of-week variance and let Google fully re-crawl and re-index the changed pages. Shorter windows risk drawing conclusions from noise rather than a genuine CTR difference.
Can I A/B test SEO without a CRO platform?
Yes — Google Search Console combined with a spreadsheet covers the core requirements: performance data by page, a place to calculate CTR deltas, and a hypothesis log. A dedicated CRO or testing platform becomes more useful once you're running several concurrent tests across many templates rather than one or two at a time.
Do meta description changes affect rankings?
No, meta descriptions are not a direct ranking factor — they only affect whether a searcher clicks on your result, making them a lower-risk element to test than title tags. Title tags, by contrast, can influence both rankings and CTR, so title changes should be monitored for position shifts as well as click changes.
How do I know if my SEO A/B test result is statistically significant?
Run a two-proportion z-test or chi-square test comparing clicks and impressions between your control and variant groups, using a free online calculator, and look for a result at the 95% confidence level. Anything below that threshold means the observed difference could be due to chance, and the test should be extended rather than concluded.
What's the most common mistake in DIY SEO A/B tests?
Testing too many variables at once — changing the title, description, and URL simultaneously — is one of the most common mistakes, since it makes it impossible to attribute a CTR change to a single factor. Stopping a test early after seeing promising early numbers ("peeking") is a close second, and it frequently leads to false positives.
Keep reading
- Subdomain vs Subdirectory SEO: The Real Decision FrameworkSubdomain vs subdirectory SEO, resolved: what Google says, what migration data shows, and a 5-question framework to pick the right structure.
- Answer Engine Optimization: A Platform-by-Platform GuideAnswer engine optimization explained for ChatGPT, Perplexity, and Google AI Mode — with a practical, platform-aware framework to earn citations in 2026.
- SEO Content Calendar: A Data-Driven New/Refresh/Prune PlanBuild an SEO content calendar that allocates effort across new pages, refreshes, and pruning using real performance data — not gut feel.